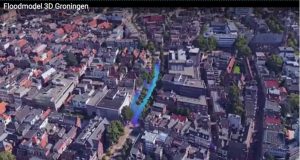
The flood map of Groningen shows inundated points in the center that are known to flood during heavy stormwater events with a maximum level about 50 cm. Social media
posts, photos and videos from citizens were gathered by researchers to verify these points. The municipality is
advised to reduce the vulnerability to flooding by reshaping some streets during reconstruction of the area. Those streets will be designed in such a way that they can convey the excess storm water without causing flood problems. This way the roads themselves will act as a cost effective drainage system by discharging stormwater to the surface water bodies, preventing the flooding of houses. Combining the elevation model, the dataset with buildings and aerial photographs a 3D
model of the city is created to get an improved overview of the outcomes of the model. These visualisations and interactive communication tools can be used to encourage knowledge-sharing of climate-proofing and urban resilient projects.
Please visit the following link https://www.youtube.com/watch?v=VZRmObjIQpI to see a video of the ‘Floodmodel 3D Groningen’.
More detailed information on flood-maps and INXCES project:
Floris Boogaard, Jeroen Kluck , Govert Schoof, Michael Bosscher, The need for INnovations for eXtreme Climatic EventS (INXCES), the progress of flood modeling case Bergen Norway, COST, 2017 (video: https://www.youtube.com/watch?v=EY-ZIKlYEZw)